
The Great Unravelling: U.S. Reciprocal Tariffs and Bangladesh
Gender-Responsive and Climate-Resilient Solutions for Urban Areas in Bangladesh

RAPID Data Center_Ok
Contents
Two Growth Stories and Trade Policy Choices
Wage Rate & Inflation Trends – FY25
Figure 4: Wage Rate Index in FY25 (%)
Figure 5: Inflation in FY25 (%)
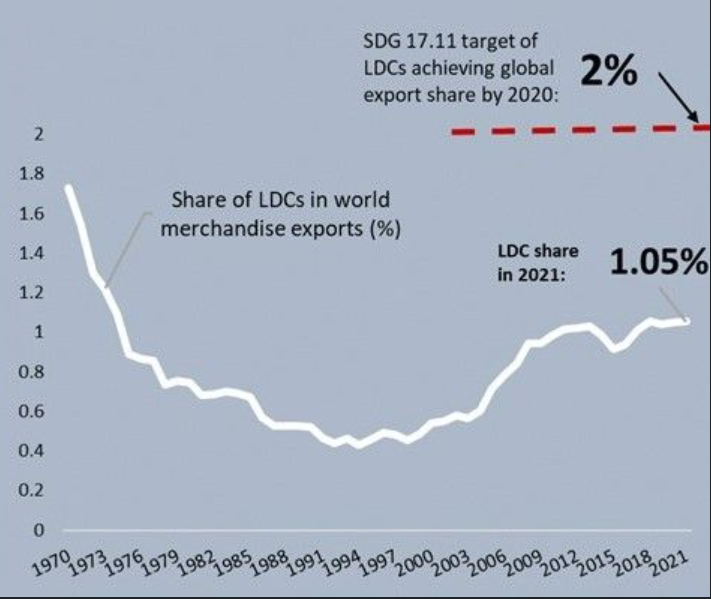
Time to revisit the SDG targets and timeline?
Figure 4: Wage Rate Index in FY25 (%)
Figure 5: Inflation in FY25 (%)
Apparel Exports: A Tale of Two Countries in Two Markets
Over the past decade, China's share in EU imports of clothing items has fallen. Bangladesh has been able to capture much of China's lost share. China has lost its share in the US market as well, but Vietnam has been the main beneficiary. The duty-free market access that the EU grants to the least developed countries (LDCs) has helped Bangladesh. The US has never given such preference to Asian LDC exporters of apparel items. The striking contrast between EU and US markets bears important implications for Bangladesh's graduation from the group of LDCs (set to take place in 2026).
The demise of export-led growth
Following the success of the so-called Asian Tigers, many developing countries pursued an export-led growth strategy. Such a strategy will mean the share of exports in GDP to rise thereby propelling economic growth. The average export-GDP ratio for global economies steadily rose from 11% in 1970 to 31% in 2008. It then started retreating and fell to 26% in 2020.An overwhelming majority of Asian developing economies now experience a falling export-GDP ratio (Vietnam is notable among a few exceptions).
Some countries’ export orientation peaked at much higher levels than others. Malaysia reached 120% in 1999 before gradually declining to around 70% by the late 2010s.
Taiwan saw 80% in 2011 and Thailand 70% in 2008, and by the next decade, their export orientation would fall to around 60% and 50%, respectively. China peaked at 36%—considered a remarkably high level given its size—before witnessing a rapid fall to just half of that level by 2020.
India registered a maximum of 25% in 2013 before falling to 18% in 2020. Bangladesh peaked at 20% (in 2012), which then fell steadily to 13%.Pakistan’s highest export orientation was recorded just at 15% (in 2003) and was less than 10% in 2020.
These countries are now driven by domestic demand-led growth.However, the recent trend of a rapid fall in export orientation along with uncertainty in global trade and economic environments may have profound implications for trade policy choices.
Will countries now find protectionist policies more appealing than ever?

The Low-Hanging Fruit That Remains Elusive
During the three decades of 1970—2000, the combined share of 48 UN-designated least developed countries (LDCs) in global merchandise exports fell from 1.72 per cent to just 0.45 per cent. Then the global community became upbeat about the revival of LDC trade performance as its global export share more than doubled to 1 per cent in 2011. Expectations were so high that one of the Sustainable Development Goals (SDGs) set a target of the LDC share of global exports doubling further to 2% by 2020 (yes, 2020 and not 2030 as the stipulated target date for most other indicators). Since the adoption of the SDGs in 2015, the relative significance of LDCs in global export trade has virtually stagnated at 1 per cent. Achieving a 2 per cent share even by 2030 now looks like a daunting prospect. But still, it is most appropriate to fix a new timeline for this target (SDGs 17.11.1).